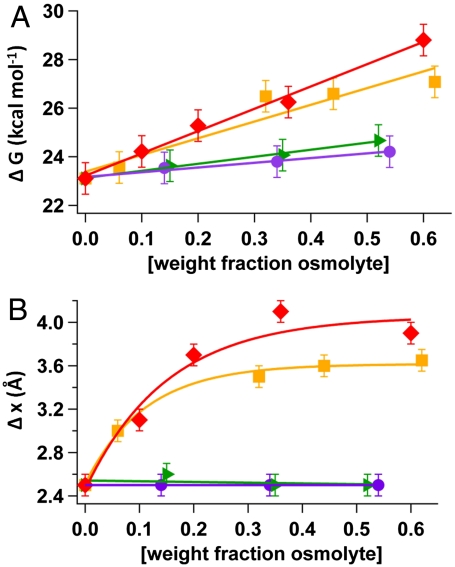
Fig. 4.
Osmolyte participation in the unfolding transition state of protein. (A) Unfolding energy barrier ΔGu and (B) distance to the unfolding transition state Δxu for a range of ethylene glycol (squares), propylene glycol (diamonds), sorbitol (triangles), and sucrose (circles) solutions of varying weight percentage (osmolyte) obtained from force-clamp experiments. The dashed line in A shows monotonic increase of ΔGu with concentration of osmolyte. The dashed line in B shows exponential increase of Δxu with concentration of ethylene glycol and propylene glycol and monotonic behavior with concentration of sorbitol and sucrose

