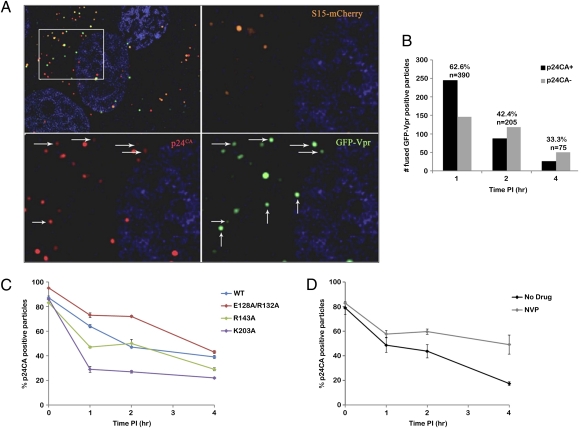
Fig. 1.
Results from the in situ uncoating assay. (A) Top Left: One Z-section from a 1 h time point. The outlined box is enlarged in the other three panels to show S15-mCherry, GFP-Vpr, and p24CA signals. Fused virions are punctate signals that are GFP positive and mCherry negative, and were classified as associated with p24CA (horizontal arrows) or not associated with p24CA (vertical arrows). (B) Number of coated and uncoated fused virions counted at 1, 2, and 4 h post-infection. Above each bar is the percentage of coated viral particles and the total number of virions counted. (C) In situ uncoating assay was conducted on wild-type and p24CA mutants. Graphed is the percentage of coated viral particles at each time point. Error bars denote SE among three independent experiments. (D) In situ uncoating assay was conducted in the presence or absence of nevirapine (NVP). Graphed is the percentage of coated viral particles at each time point. Error bars denote the SE among two independent experiments.

