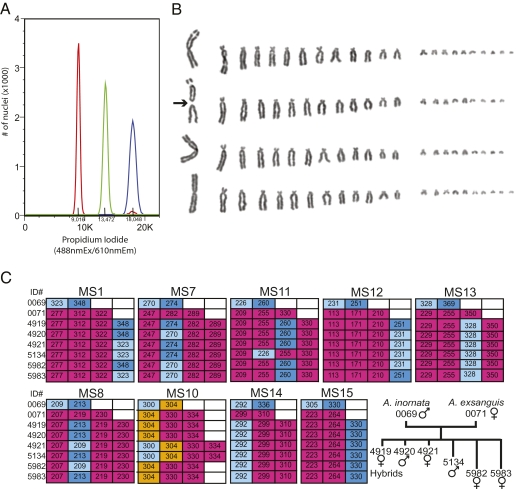
Fig. 2.
DNA and chromosome analysis. (A) Determination of DNA content of whole blood nuclei by propidium-iodide staining followed by FACS analysis. A comparison between diploid A. inornata (red), triploid A. exsanguis (green) and a putative hybrid (blue) indicates a tetraploid DNA content for the hybrid. (B) The karyotype of the A. exsanguis/A. inornata hybrid was determined from metaphase chromosomes of cultured cells. Each row shows a haploid chromosome set, with chromosomes arranged by decreasing size. The centric fission of one of the three large chromosomes is indicated with an arrow. (C) Microsatellite analysis at nine loci in the A. exsanguis and A. inornata parents and the six hybrid progeny. The tree depicts the relationships between the eight animals. Unique alleles of A. exsanguis and A. inornata are highlighted in red and blue, respectively. In some experiments, an additional peak at 261 was observed for MS15, but was not reproducible in repeat runs and is considered a technical artifact.

