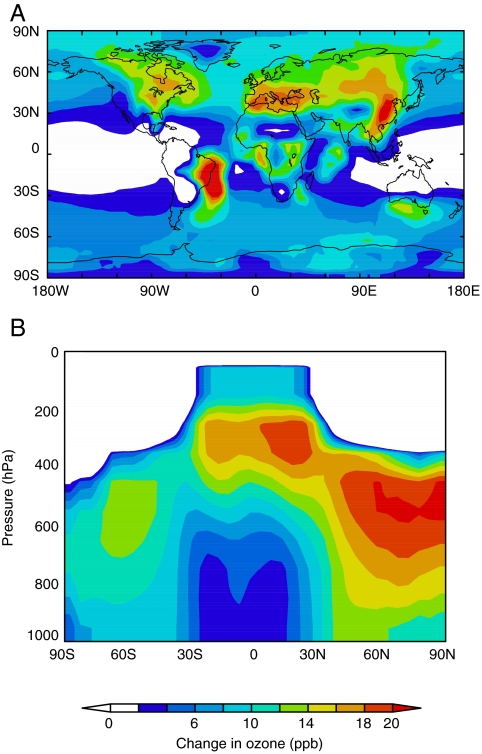
Fig. 2.
Elevated surface ozone concentrations in the Eocene compared to the preindustrial world. Simulated increases in (A) mean annual surface level ozone for the 4 × CO2 Eocene simulation and (B) the cross-sectional zonal average profile through the atmosphere. Ozone increases in (A) and (B) are relative to the preindustrial control simulation. Note in (A) changes in ozone fields are plotted over the present-day continental geography.

