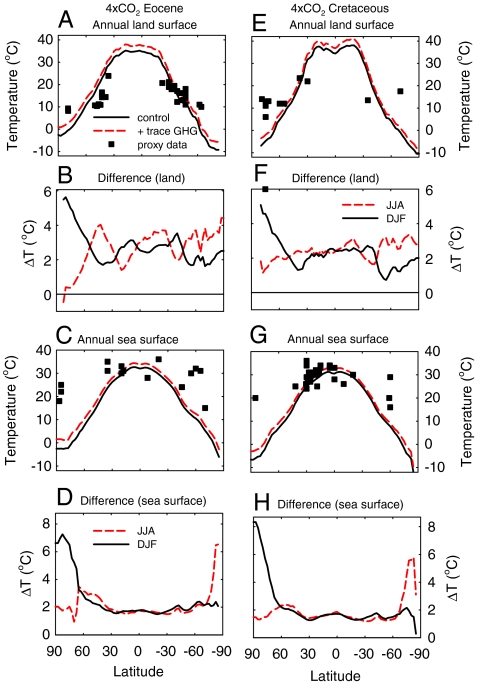
Fig. 4.
Simulated latitudinal temperature gradients in the Eocene and Cretaceous. (A) Latitudinally averaged mean annual land surface temperature in the Eocene (4 × CO2 concentration) for the control runs (preindustrial concentrations of trace greenhouse gases, black line) and after inclusion of the positive feedback of elevated trace greenhouse gases (red line). (B) Changes in latitudinally averaged seasonal mean annual land surface temperature due to forcing by elevated trace greenhouse gas concentrations relative to the control simulation. JJA; June, July, August; DJF; December, January, February. (C) and (D) as (A) and (B) but for sea-surface temperature. (E–H) Equivalent plots as for A–D, but for the 4 × CO2 Cretaceous simulations. Proxy data sources for panels A, C, E and G are given in SI Text.

