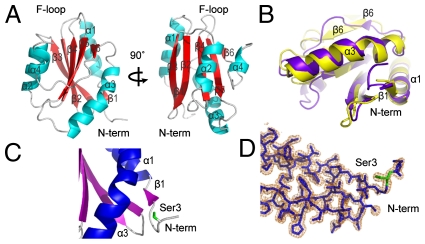
Fig. 2.
Crystal structure of PfADF1 confirms the conserved G-actin binding fold. (A) Schematic representations of the overall fold of PfADF1 related by 90° rotations. (B) Overlay of crystal structures of PfADF1 (3Q2B; purple) and ScCOF (PDB ID code 1COF; yellow) orientated to show the G-actin binding face conserved between two proteins. (C) Cartoon representation of PfADF1 structure showing Ser3 at the N-terminal tail. (D) 2|Fo|-|Fc| electron density map depicting the N-terminal tail of PfADF1. Residue Ser3 is shown as a green stick. The map is contoured at 1.2 σ. Water molecules have been removed for clarity.

