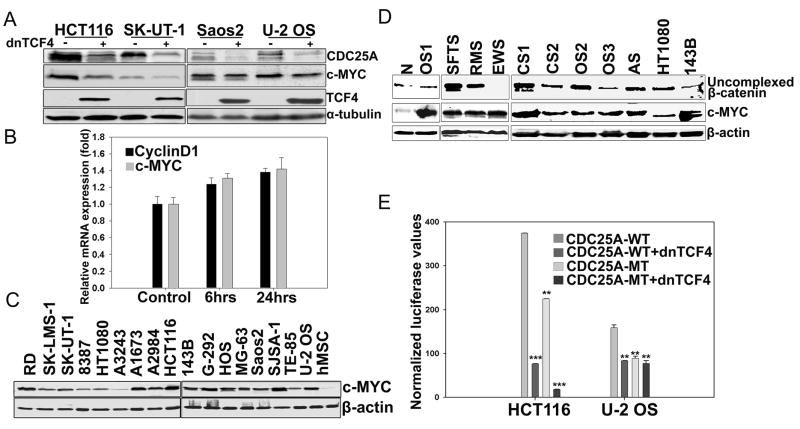
Figure 6. Lack of correlation between Wnt signaling and c-MYC levels in human sarcomas.
(A) Human sarcoma lines and HCT116 cells were stably transduced with dnTCF4 and proteins were analyzed by Western blotting.
(B) Real-time PCR analysis of c-MYC and CyclinD1 in hMSCs treated with Wnt3A as described in Figure 3A. The values were normalized to TBP and represented relative to those in untreated cultures (Control), which were set at 1. Error bars indicate SD of mean values from triplicates and are representative of two independent experiments.
(C) Western blot analysis of human sarcoma cell lines for c-MYC protein.
(D) C-MYC protein expression in protein extracts from frozen sections of primary sarcoma tissues. N:Normal tissue; CS: Chondrosarcoma; AS:Angiosarcoma. All other abbreviations for sarcomas are described in Figure 1. HT1080 and 143B lines were used as positive and negative controls for Wnt activated sarcomas.
(E) HCT116 or U-2 OS cells were co-transfected with vector control, CDC25A-WT, or CDC25A-MT (see Fig. 3F) luciferase reporter constructs (200ng) and a dnTCF4 expression construct (400ug). Luciferase values were measured 48 hrs post-transfection and normalized to Renilla. Error bars indicate SD of mean values from triplicates and are representative of two independent experiments. *p<0.1, **p<0.01, ***p<0.001 by student’s t test.
See also Figure S5.

