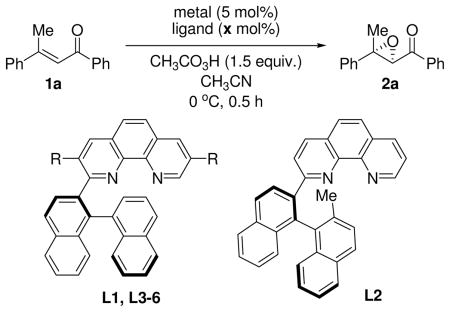
Table 1.
Screening of reaction conditions
 | |||||
|---|---|---|---|---|---|
| entry | metal | ligand L (R) | x | 2a | |
| % yielda | % eeb | ||||
| 1 | FeCl2 | L1 (R=H) | 10 | 17 | 3 |
| 2 | Fe(OTf)2 | L1 (R=H) | 10 | 95 | 57 |
| 3 | Fe(OTf)2 | L2 | 10 | <5 | 17 |
| 4 | Fe(OTf)2 | L3 (R=Ph) | 10 | 93 | 83 |
| 5 | Fe(OTf)2 | L4 (R=o-Tol) | 10 | 72 | 75 |
| 6 | Fe(OTf)2 | L5 (R=m-xylyl) | 10 | 88 (80) | 91 |
| 7 | Fe(OTf)2 | L6 (R=m-Et2C6H3) | 10 | 64 | 86 |
| 8 | Fe(OTf)2 | L5 (R=m-xylyl) | 5 | 73 | 78 |
| 9 | Fe(OTf)2 | L5 (R=m-xylyl) | 15 | 25 | 53 |
| 10c | Fe(OTf)2 | L5 (R=m-xylyl) | 5 | 81 | 86 |
Yields were determined using 1H-NMR analysis with 1,1,2,2-tetrachloroethane as an internal standard. The value in parentheses represents isolated yield
Determined by chiral HPLC analysis.
2.5 mol% of Fe(OTf)2 was used.
