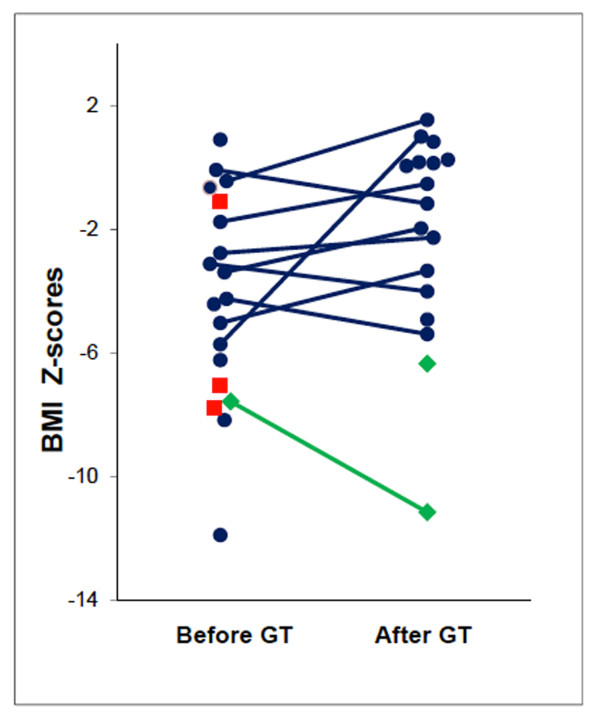
Figure 3.
BMI Z-scores before and after GT placement. Blue circles represent individual patients who tolerated GT placement and used GT's. Green diamonds represent the two patients who tolerated GT placement but did not use their feeding tubes. Red squares represent the three patients with early mortality. Percentile BMI Z-score is based on NHANES normal values for age and gender. For patients older than 20 years, percentile BMI Z-scores were based upon NHANES normal values for the age of 19 years 11 months and gender. Source for BMI calculations: http://statcoder.com/

