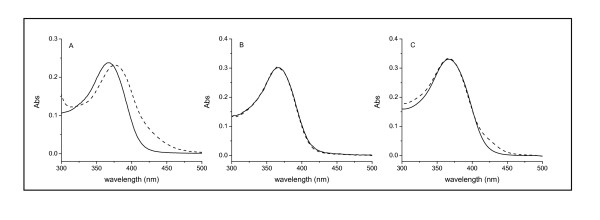
Figure 15.
UV-Vis spectra of free and bound Q to D-BSA, D-Lys, and D-Mb. The concentration of Q was 1.5 × 10⁻⁵ mol/L. The concentration of DMSO was maintained at 10%. The concentration of (A) BSA, (B) Lys, or (C) Mb was 1.5 × 10⁻⁵ mol/L. The solid line represents free Q, and the dashed line represents bound Q.

