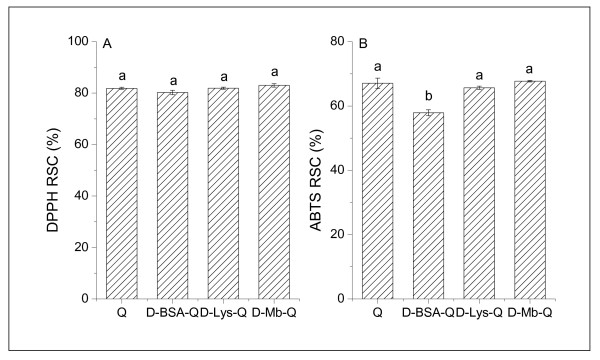
Figure 18.
DPPH and ABTS scavenging activity of Q and embedded Q. The concentrations of Q was 1.50 × 10⁻⁵ mol/L. The concentration of the proteins (BSA, Lys, and Mb) was 1.5 × 10⁻⁶ mol/L. The (A) DPPH and (B) ABTS scavenging activities of the proteins were also subtracted from the embedded Q. Markers of different letters in the figure denote that the mean difference is significant at P < 0.05.

