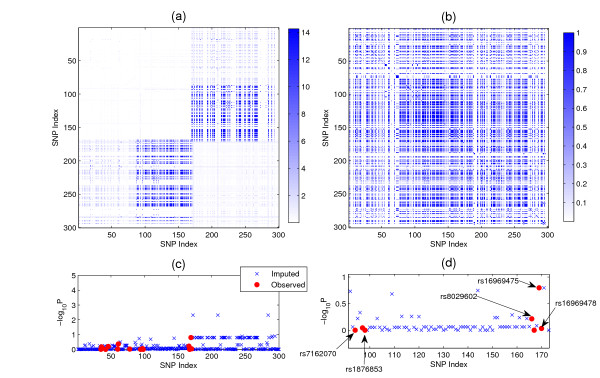
Figure 5.
Analysis result of the local region of the CAD data set located by rs7162070, rs1876853, rs8029602, rs16969475 and rs16969478. (a) The enriched signal after imputation: The -log10P value given by the joint regression. (b) The LD structure (r2) in the same region. (c) The -log10P of single SNP analysis. (d) The locations of the genotyped SNPs rs7162070, rs1876853, rs8029602, rs16969475 and rs16969478.

