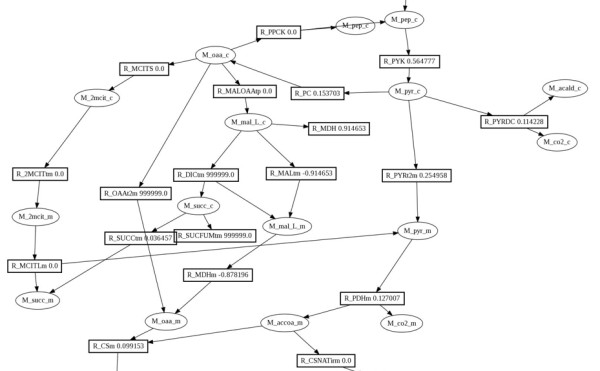
Figure 6.

Visualisation of numerical results on pathway maps within the web interface of Acorn system. Network map created with desktop editor and stored in the database is used. The reaction fluxes or FVA flux ranges are printed within reaction symbols. The figure shows an image generated by web interface showing reaction fluxes within the part of the central metabolism map of S. cerevisiae iND750 model. The results have been obtained during FBA optimisation of biomass flux.
