Figure 7.
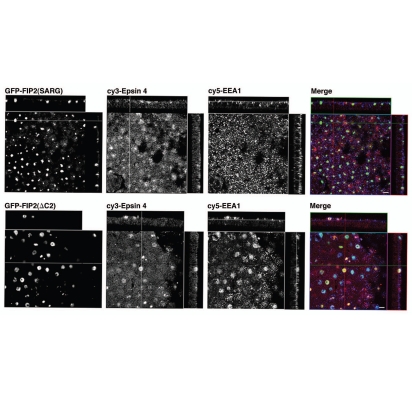
Rab11-FIP2(ΔC2) alters the distribution of both Epsin 4 and EEA-1. Confocal fluorescence microscopic images of polarized MDCK cells. X-Y plane images are shown flanked by X-Z projections (horizontal) and Y-Z projections (vertical). T23 cells stably expressing either (upper parts) EGFP-FIP2(SARG) or (lower parts) EGFP-FIP2(ΔC2) were stained with antibodies against Epsin 4 (Cy3 secondary, pseudo-colored red) and EEA-1 (Cy5 secondary, pseudo-colored blue) antibodies and imaged by confocal microscopy. EGFP-FIP2(ΔC2) expression caused accumulation of both EEA-1 and Epsin 4 around the collapsed membrane cisternum. Images were taken with a 100x lens with a 3x zoom. Scale bars represent 5 µm.

