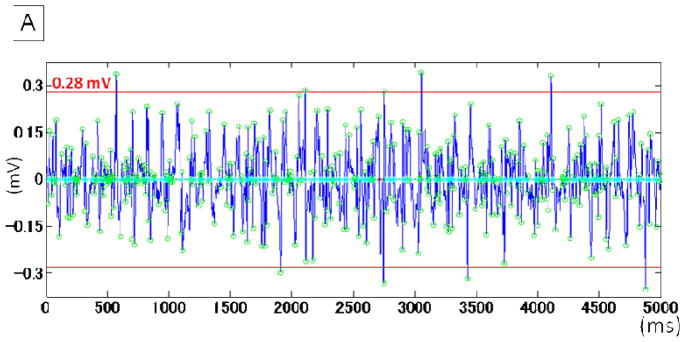
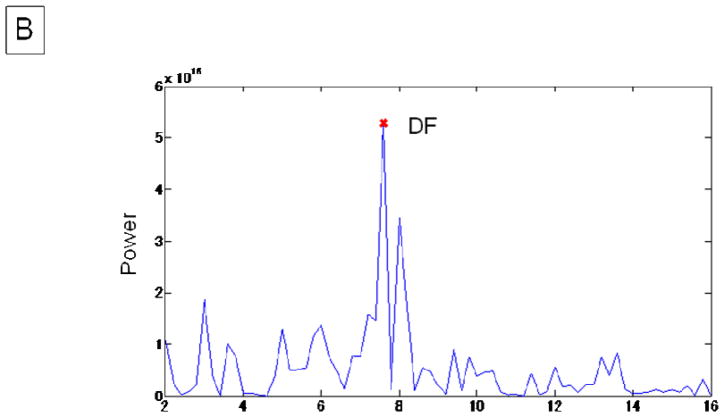
Figure 1. Measurement of atrial voltage and DF.
A. Electrogram voltage was defined as the mean of 10 the largest electrograms in a sampling window of 5000 ms and measured by custom software in the MatLab environment. The open green circles indicate the detection of peak electrogram amplitude. The red lines indicate the amplitude in this recoding period (0.28 mV).
B. The periodogram of the same recording period shown in panel A. The DF was 7.60 Hz.
DF: dominant frequency


