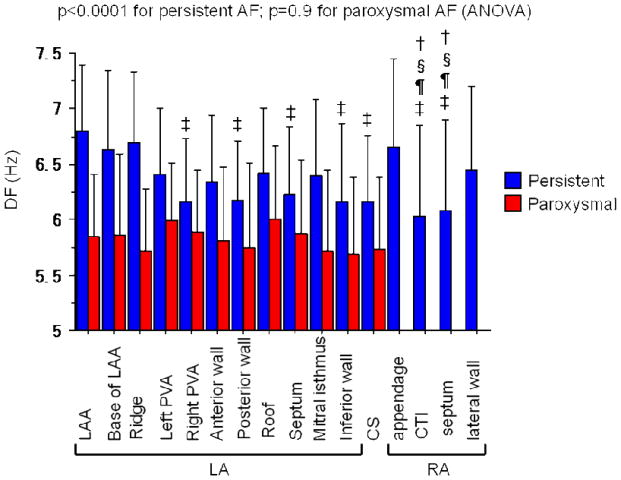
Figure 2.
Mean DF at each region in persistent (blue) and paroxysmal (red) AF.
In patients with persistent AF, the mean DFs at 11 regions in the LA, at 4 regions in the RA, and in the CS are shown. There was a significant difference in the mean DF across the regions (p<0.0001, ANOVA).
‡: p<0.05 vs. DF at the LAA, §: <0.05 vs. DF at ridge, †: <0.05 vs. DF at base of LAA, ¶: <0.05 vs. DF at RAA.
In patients with paroxysmal AF, there was no difference in regional DF (p=0.9).
LA: left atrium, LAA: left atrial appendage, PVA: pulmonary vein antrum, CS: coronary sinus, RA: right atrium, CTI: cavotricuspid isthmus, RAA: right atrial appendage.

