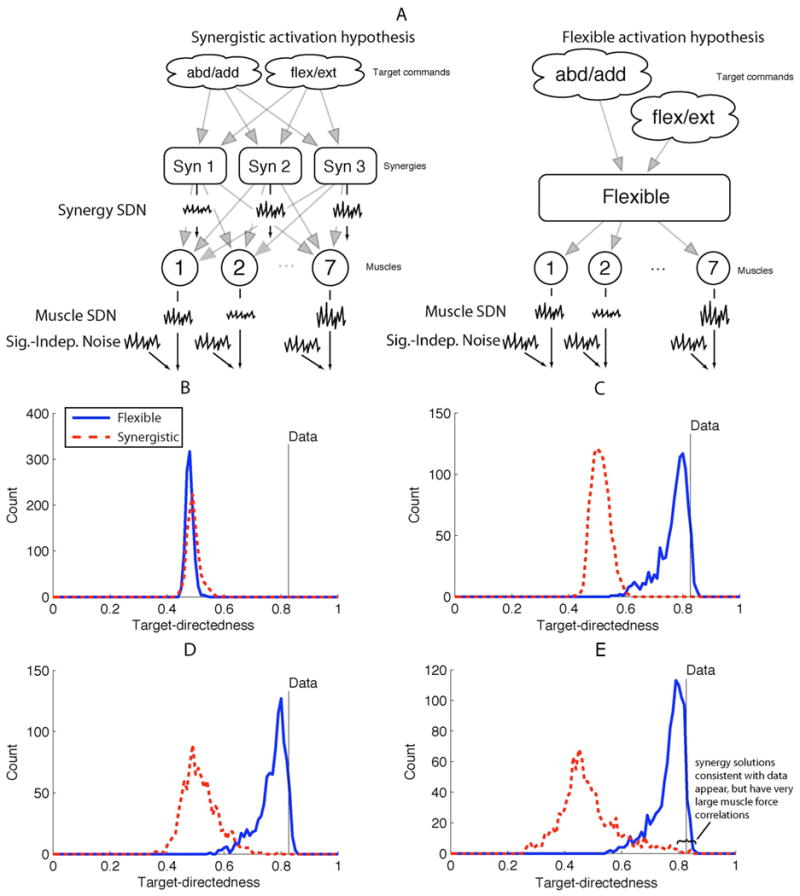
Fig. 10.

Example of Monte Carlo hypothesis testing. (A) Illustration of two hypotheses and sources of noise. (B)–(D) Monte Carlo distributions of test statistics (target-directedness) generated by the two models, as compared with the experimentally observed value. The synergistic hypothesis can only replicate the data under specific conditions, and induces muscle force correlations that are unrealistic. Adapted from [231]. (A) Hypotheses and noise sources. (B) Both hypotheses have Sig-Indep. Noise only. (C) Both hypotheses have Muscle SDN only. (D) Flexible hypothesis has only Muscle SD, synergistic hypothesis has Muscle SDN and Synergy SDN equally. (E) Flexible hypothesis has only Muscle SDN, synergistic hypothesis has Synergy SDN ten times Muscle SDN.
