
Fig. 9.
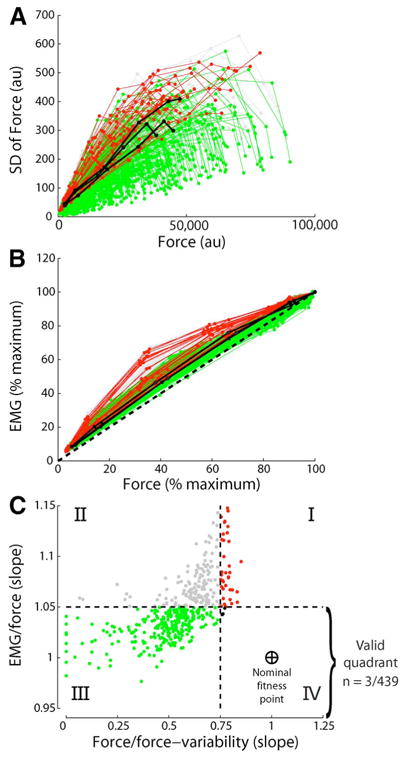
Monte Carlo analysis of the Fuglevand Model. (A) Each line shows the force/force-variability relation generated by different parameter sets. (B) Each line shows the EMG/force relation generated by the same parameter sets shown in (A). (C) Relations found in (A) and (B) are evaluated by test statistics that are regression slopes [log-log in the case of (A)]. Good fits to experimental data are force/force-variability slopes of greater than 0.75 and EMG/force slopes of less than 1.05; thus, very few parameter sets are able to reproduce experimental data. Adapted from [97].