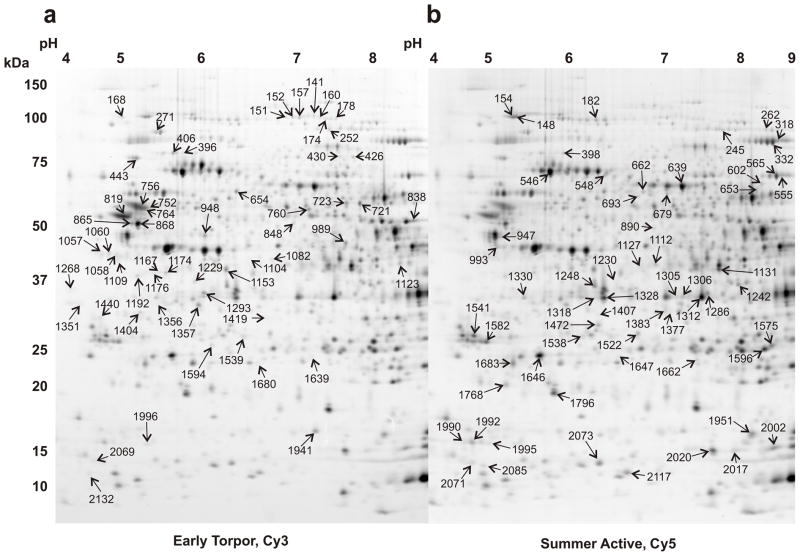
Fig. 2.
Brainstem protein differences between SA and ET. Two different Cy images from a single gel separation of soluble 13-lined ground squirrel brainstem proteins by 2DE are shown. (a) ET brainstem proteins labeled with Cy3, master numbers are indicated for spots elevated in ET. (b) SA proteins labeled with Cy5, master numbers are indicated for spots elevated in SA over ET. On the left side of the figure are markers of approximate molecular mass in kDa, and across the top are indicated the approximate isoelectric (pI) values in pH.

