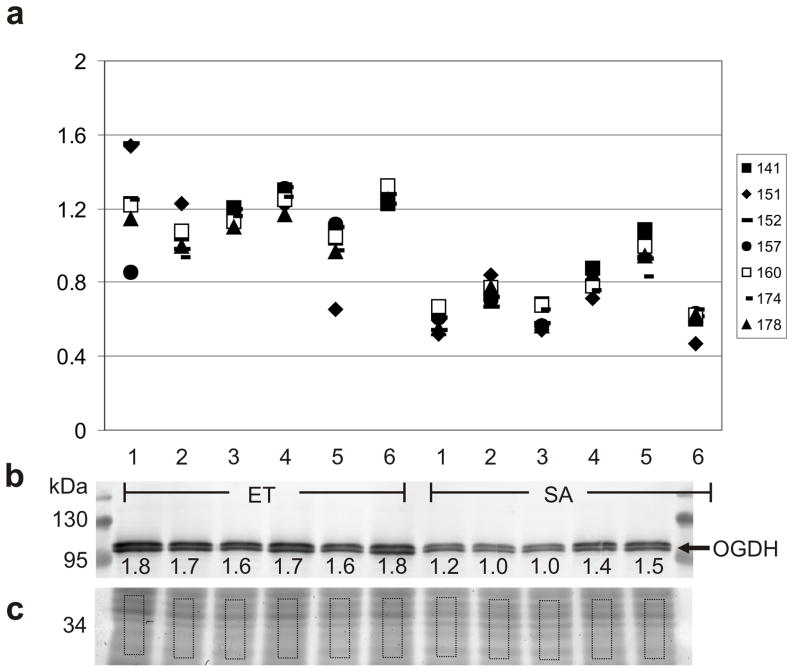
Fig. 3.
Comparison of DIGE and western quantitation for OGDH. (a) Isoform-specific quantitation using the normalized spot volumes obtained by DIGE of seven 2D gel spots for which OGDH was the uniquely identified protein; symbols represent protein spots as indicated; ET: n=6, SA: n=6; fold changes and Student’s t-test p values for each of the seven OGDH spots are in Table 1. DIGE values are aligned with western blot lanes, except for the depleted SA6. (b) Western blot distinguishes two isoforms of OGDH at ~114kDa; after electrophoretic separation, the protein gel was cut and proteins in the top portion were transferred for immunoblotting, the bottom (c) was stained with Sypro Ruby. Molecular mass is indicated in kDa, normalized volumes are indicated under each band after correction for protein loading to the volume of the corresponding rectangle in the Sypro Ruby-stained portion of gel. Fold change for OGDH (combined bands) as determined by western, 1.39X (ET>SA); ET: n=6, SA: n=5; p<0.0006, Student’s t-test.

