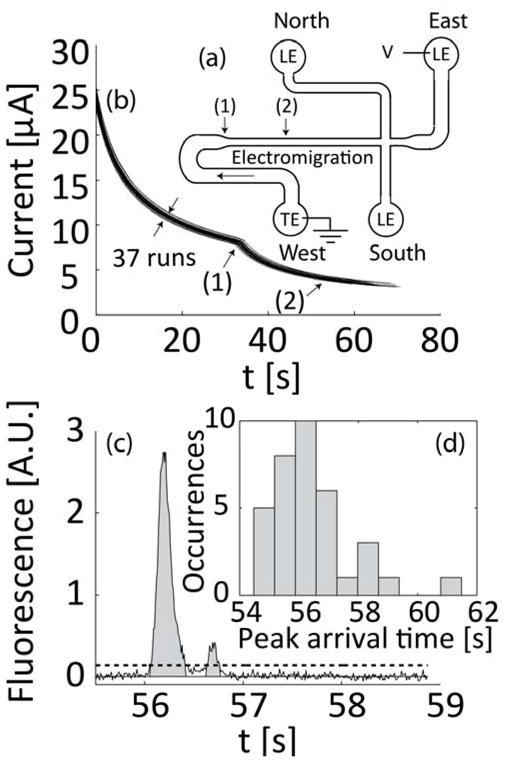
Figure 3.

Microfluidic chip and experiments to establish analyte quantitation. (a) Schematic of the microfluidic chip showing the direction of electromigration, the area where channel width decreases (1), and location of detector (2). (b) Current was measured in real-time for all experiments. Current monitoring is important for interpretation of fluorescence signal integrals and allows detection of unwanted effects such as clogging of the channel or significant variations in initial conditions. Sample lysing (and dilution) were optimized for repeatability. Shown are overlayed time traces of 37 runs for sample concentrations of 1E6 to 1E8 cfu/ml and negative control samples. (c) Typical fluorescent signal with bacterial sample. We integrate the signal to estimate the total amount of focused sample. We determine signal baseline using the GIFTS method40 and then integrate the data in regions where values are 5 standard deviations above the baseline noise level. Integration values are measured from – the mean background noise level, as indicated by gray area). (d) Histogram showing the distribution of peak arrival time for the 37 runs presented in (b). The standard deviation of arrival times (at (1)) is less than 5% of the mean.
