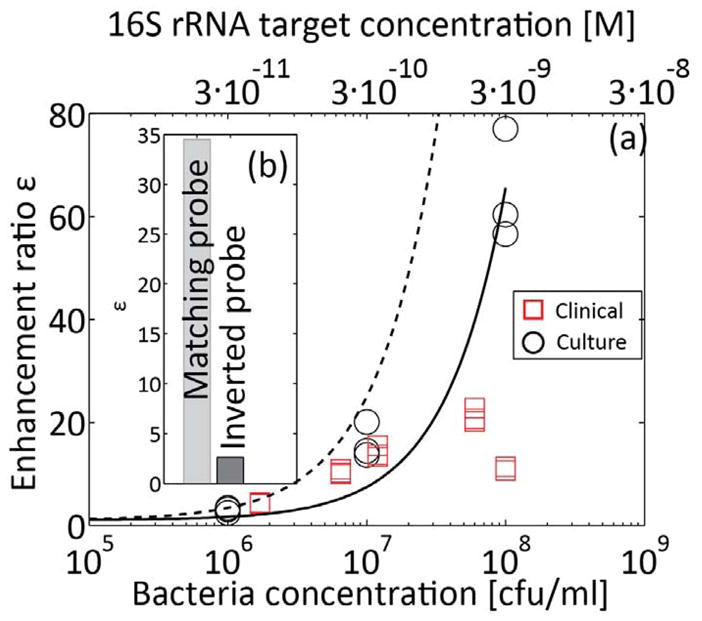
Figure 5.

Quantitative detection of E. coli 16S rRNA sequence from bacterial cultures, and bacterial detection in patient urine samples.. The solid line is presented to aid visualization, and corresponds to a best linear fit on bacteria cultures results. The dashed line corresponds to the equilibrium model (equation (6)) for α/β* 80. 16S rRNA was extracted and focused with molecular beacons using ITP, and detected on chip. (a) Measured enhancement ratio for cultured bacteria samples (circles) and urine samples (squares) at clinically relevant bacterial concentrations. The top horizontal axis shows estimate molar concentration of target in the initial urine sample. The bacteria concentrations presented on the x-axis were evaluated separately using cell plating. The lysing procedure described in Figure 4 was used for all samples, and followed by incubation with molecular beacons for 5 min at 60°C. The limit of detection is approximately 1E6 cfu/mL, with an enhancement ratio of ~3 (b) We checked the specificity of the probe by performing the assay with a molecular beacon having an inverted probe sequence (from 3′ to 5′). While some non-specific hybridization was observed, the enhancement ratio using the inverted probe is significantly lower.
