
Table 4.
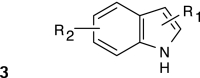
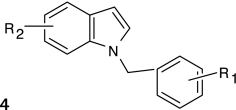
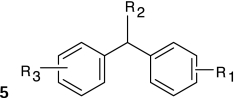
Structures and Activities of PXR Actives
| Series | Count | Active | Potency range (μ M) |
|---|---|---|---|
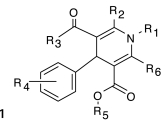 |
9 (6) | 8 (5) | 0.01–31.6 (1.41–28.2) |
| 201 (35) | 35 (9) | 2.51–31.6 (4.47–31.6) | |
 |
394 (58) | 91 (8) | 0.28–35.5 (0.28–10.0) |
 |
19 (7) | 9 (2) | 2.0–28.2 (2.0–12.6) |
 |
478 (84) | 137 (26) | 0.09–31.6 (0.04–28.2) |
 |
124 (26) | 30 (7) | 0.11–25.1 (0.11–12.6) |
 |
115 (5) | 17 (2) | 2.23–31.6 (8.9–12.6) |
 |
24 (6) | 17 (5) | 3.16–31.6 (3.16–15.8) |
Numbers in parentheses represent data for the LOPAC library.