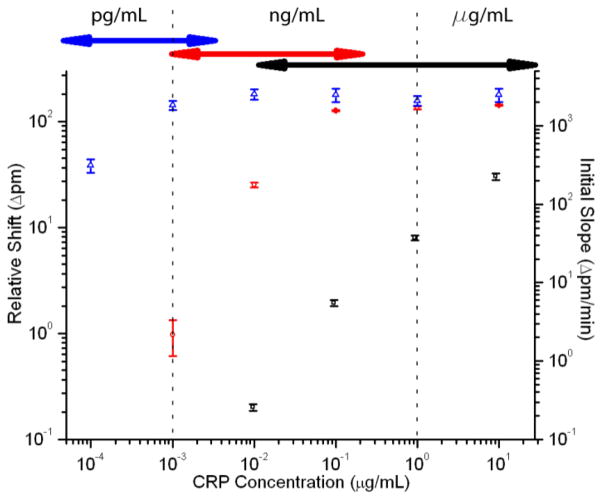
Fig. 2.
Log-log calibration plot showing the response of the microring resonators to varying concentrations of CRP using the three-step assay. Black squares indicate the initial slope of the primary binding (right axis), red circles indicate secondary antibody shift, and blue triangles indicate bead shift (left axis). Error bars represent 95% CI for n=17–47 rings for each concentration. Arrows at top represent overlap of dynamic ranges for each assay portion.

