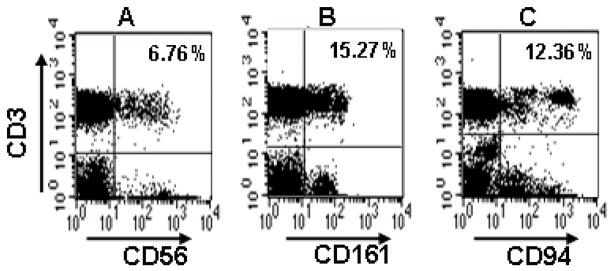
Fig. 1.
Representative flow cytometric dot plots showing NKR+ T-cells in a healthy control subject. Lymphocytes were gated on the basis of cell size and granularity (FSC/SSC). The percentages of CD3+ T-cells expressing the natural killer receptors CD56, CD161 or CD94 are shown in the upper-right quadrants in A, B and C, respectively.

