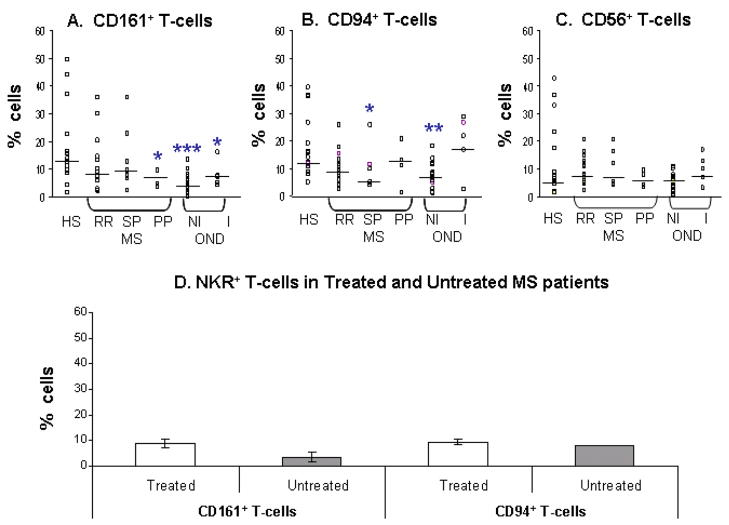
Fig. 2.
NKR+ T-cells are reduced in multiple sclerosis. Percentages of NKR+ T-cells in the CD3+ T-cell populations of healthy subjects (HS), multiple sclerosis (MS) subgroups (RR-MS, relapsing remitting; SP-MS, secondary progressive; PP-MS, primary progressive), and other neurological diseases (OND) subgroups (NI-OND, non-inflammatory OND; I-OND, inflammatory OND). Percentages of (A) CD161+ T-cells, (B) CD94+ T-cells and (C) CD56+ T-cells for each of the groups are shown. Horizontal bars indicate median values. Significance values comparing HS to MS or OND subgroups are shown by *, P < 0.05; **, P < 0.01; ***, P < 0.001. (D) Comparison of NKR+ T-cells in the peripheral blood of untreated (naïve to therapy) and treated MS patients. Data shows median values and bars indicate standard error..

