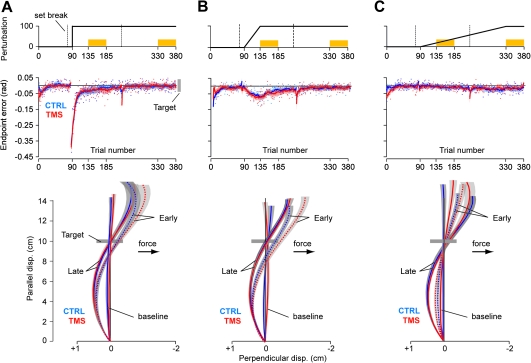
Figure 5.
Kinematics of the reach in the abrupt, intermediate, and gradual protocols. (A) Performance of the abrupt group. Top row: perturbation schedule. Middle row: endpoint error over the course of the training. The solid curves represent the running average over a window of 14 trials, which are interrupted during set breaks. Error bars are standard error of the mean (SEM). Bottom row: average trajectory profiles during baseline (trials 41–90), early (trials 136–185), and late periods (trials 331–380). Trials were rotated such that the target is represented 10 cm away in the North direction. Areas around the curves represent SEM. (B) Kinematics of the intermediate group. (C) Kinematics of the gradual group.

