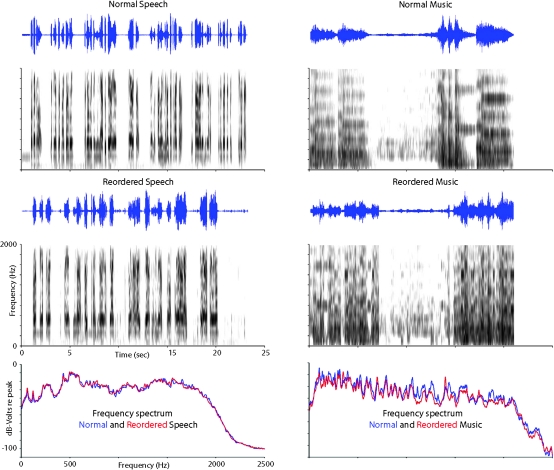
Figure 1.
Music and speech stimuli. Examples of normal and reordered speech (left) and music (right) stimuli. The top and middle panels include an oscillogram of the waveform (top) and a sound spectrogram (bottom). Frequency spectra of the normal and reordered stimuli are plotted at the bottom of each side.

