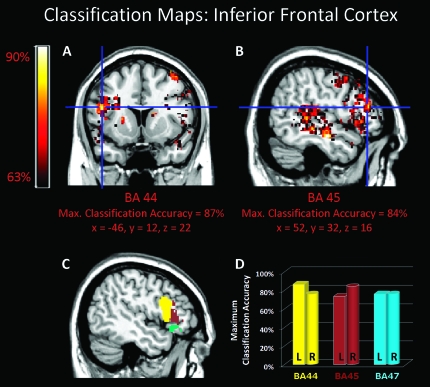
Figure 4.
MPA of temporal structure in music and speech. (A–B) Classification maps for temporal structure in music and speech superimposed on a standard brain from a single normal subject. (C) Color coded location of IFC ROIs. (D) Maximum classification accuracies in BAs 44 (yellow), 45 (brown), and 47 (cyan). Cross hair indicates voxel with maximum classification accuracy.

