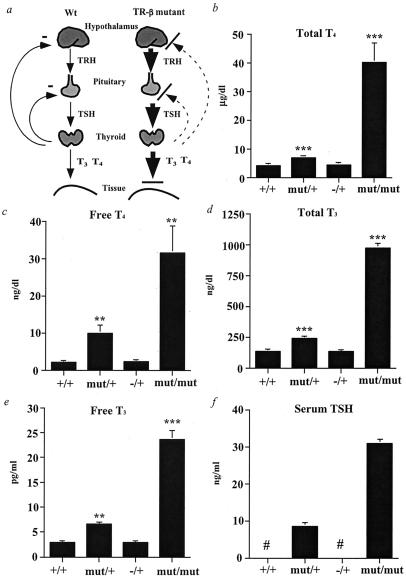
Figure 2.
Analysis of the hypothalamic–pituitary–thyroid axis in the TR-β mutant mice. (a) Schematic diagram of the axis and feedback loop in normal and TR-β mutant animals. The disruption in feedback at the hypothalamic TRH neuron is presumed but is not proven. (b–f) Serum total and free thyroid hormone and TSH levels (mean ± SEM) in serum from male mice at 4 weeks of age, as determined by RIA. +/+, n = 11; mut/+, n = 14; mut/mut, n = 6; TR-β −/+, n = 6. #, Below detection limit. **, P < 0.01 and ***, P < 0.001 vs. +/+ by t testing.

