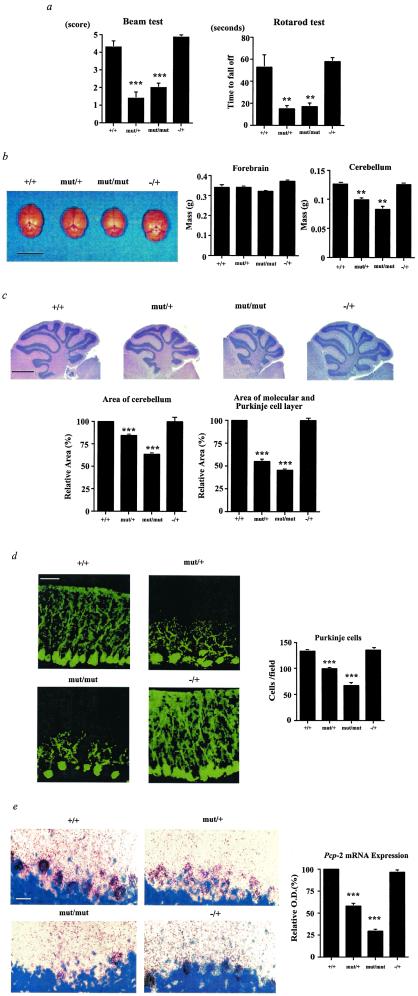
Figure 3.
Vestibulomotor function and cerebellar development in TR-β mutant animals. (a) Beam balance test and Rotarod test of male mice at 4 weeks of age (mean ± SEM). +/+, n = 19; mut/+, n = 21; mut/mut, n = 15; TR-β −/+, n = 7. Similar results have been obtained over several mouse generations (data not shown). (b) Brains of wt (+/+) and TR-β mutant animals (left side, 3.5 weeks old, male) and weight of their forebrain and cerebellum (right side, n = 3). (Scale bar = 1 cm.) (c) Hematoxylin and eosin staining and quantitation of area of mouse cerebellum and of molecular and Purkinje cell layers in mid sagittal section (3.5 weeks old, male). (Scale bar = 1 mm.) (d) Immunohistochemistry of mouse cerebellum (3.5 weeks old, male) with the use of an anti-calbindin-D28k antibody. (Scale bar = 50 μm.) Purkinje cell number was counted per ×200 magnification field. Four different comparable fields were used for each genotype. (e) In situ hybridization of mouse cerebellum with 35S-labeled Pcp-2 antisense riboprobe (3.5 weeks old, male). Black grains represent Pcp-2 mRNA. The blue region is from counterstaining with thionin. (Scale bar = 50 μm.) The grain density in Purkinje cells is shown relative to the wt (+/+) animals in the bar graph. **, P = < 0.01 and ***, P = < 0.001 vs. +/+ by t testing.

