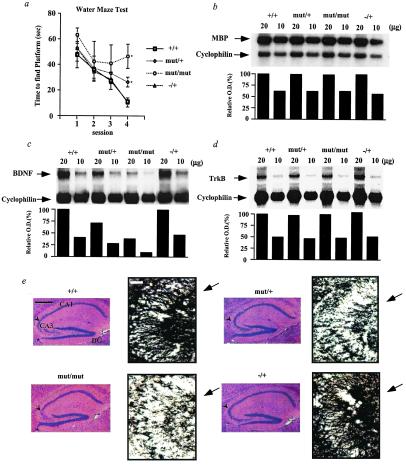
Figure 4.
Learning and gene expression in the cerebral cortex of TR-β mutant animals. (a) Spatial learning in the Morris water maze test. Male mice at 4 weeks of age [+/+ (n = 20), mut/+ (n = 28), mut/mut (n = 10), TR-β −/+ (n = 6)] were tested for their ability to learn to escape to a hidden platform. Data are expressed as mean time (in seconds) ± SEM. Mice were pretrained in two separate sessions 1 day before the test. Similar results have been obtained over several mouse generations (data not shown). (b) Northern blot analysis of myelin basic protein (MBP) mRNA levels in the cerebral cortex. (c and d) Northern blot analysis of brain-derived neurotrophic factor (BDNF) and its receptor (TrkB) mRNA levels in the anterior forebrain, respectively. (e) H&E staining of hippocampus (Left, scale bar = 0.5 mm) and immunostaining of hippocampal CA3 region with anti-BDNF antibody (Right, scale bar = 50 μm). (Left) The arrowhead indicates the CA3 region. (Right) The arrow indicates granule cell bodies stained by the anti-BDNF antibody. DG, dentate gyrus. *, P = < 0.05 vs. +/+ by t testing.

