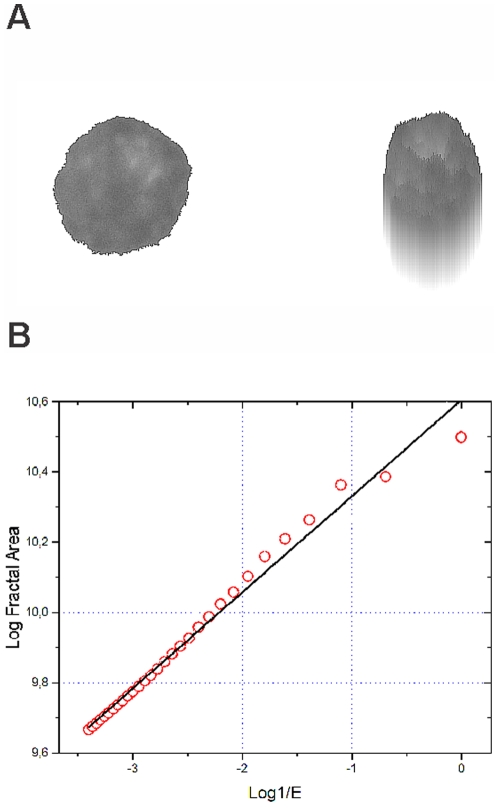
Figure 1. Segmented nucleus (left) of a myeloma cell and its pseudo 3D transformation (middle).
On the right side, the log-log-plot for the determination of the fractal dimension (FD), which is calculated from the slope of the ideal regression line (black) obtained by curve fitting. X-axis shows the logarithms of the inverse values of the size of the structuring element and y axis the logarithmic values of the fractal areas. (compare with the main text). R2 represents the goodness-of-fit of the real values (red), when compared with ideal regression line (black) and can be interpreted as a measure of “fractal quality”.

