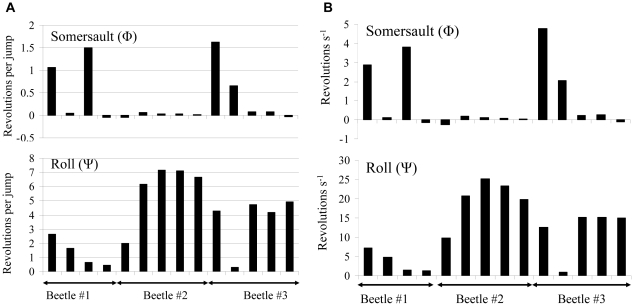
Figure 3. Body rotations in the air.
The mean rotation rate observed in 14 jumps made by three different beetles. Left figures (A) show the number of revolutions per jump and the same data is represented on the left (B) as revolutions per second. The upper and lower figures refer to somersaults and rolls respectively. Each column represents a single jump.

