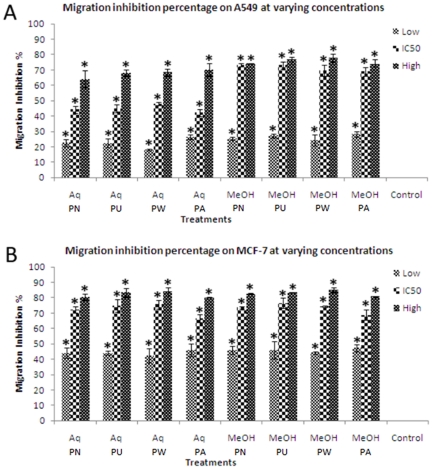
Figure 4. Migration inhibition percentage of Phyllanthus on (A) A549 and (B) MCF-7 cells treated at varying concentrations.
Error bar indicates the standard error of the mean of three independent experiments. PN – P. niruri, PU – P. urinaria, PW – P. watsonii, PA – P. amarus, Control – Non-treated cells. *P<0.05 vs control.

