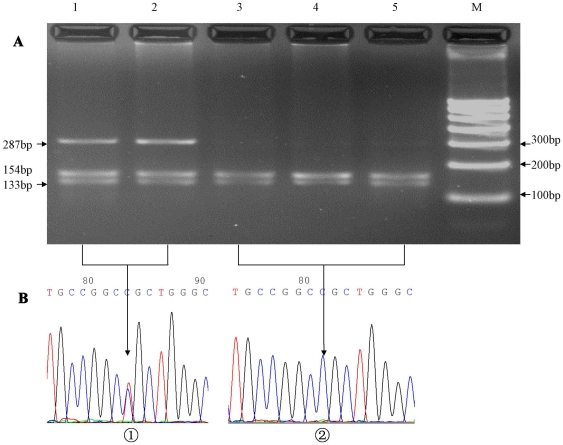
Figure 1. Restriction fragment length polymorphism analyses for determination of genotype (A).
The CT genotype shows three bands of 286 bp, 153 bp, and 133 bp (1 and 2); the CC genotype shows two bands of 153 bp and 133 bp (3, 4 and 5). Nucleotide sequences around the 698C>T polymorphism (a, CT genotype; b, CC genotype) (B).

