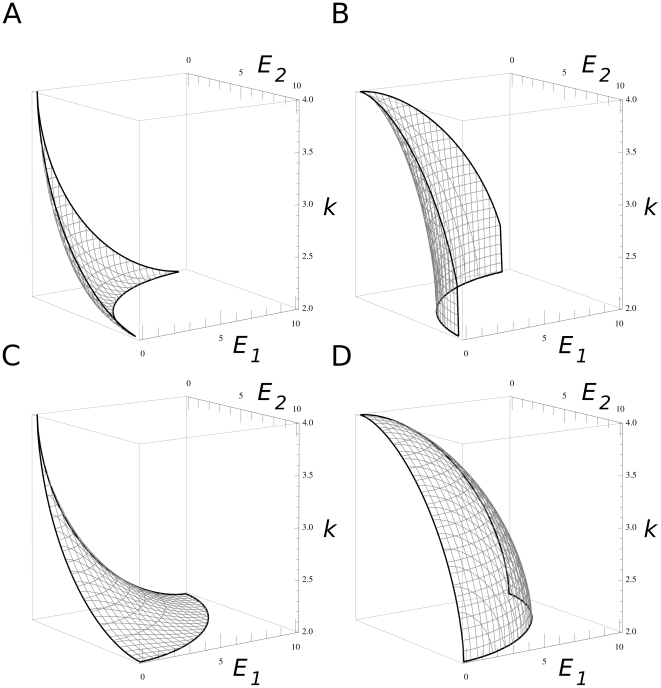
Figure 1. The E1/E2/k trade-off relation.
The E1−E2−k trade-off surface as defined by Eq. 6. The trade-off function constrains the phenotypes of newly emerging mutant replicators below the surface. A: convex function representing strong trade-off both between the two enzyme activities E1/E2 and between enzyme activities and replication rate, E/k. (b = 0.6 and g = 0.6). B: a function with convex (strong) E1/E2 trade-off and concave (weak) E/k trade-off (b = 0.6 and g = 1.67). C: concave (weak) E1/E2 and convex (strong) E/k trade-off (b = 1.67 and g = 0.6). D: both the E1/E2 and the E/k trade-offs are concave (weak) (b = 1.67 and g = 1.67). Other parameters: Emax = 10, kmin = 2, kmax = 4.

