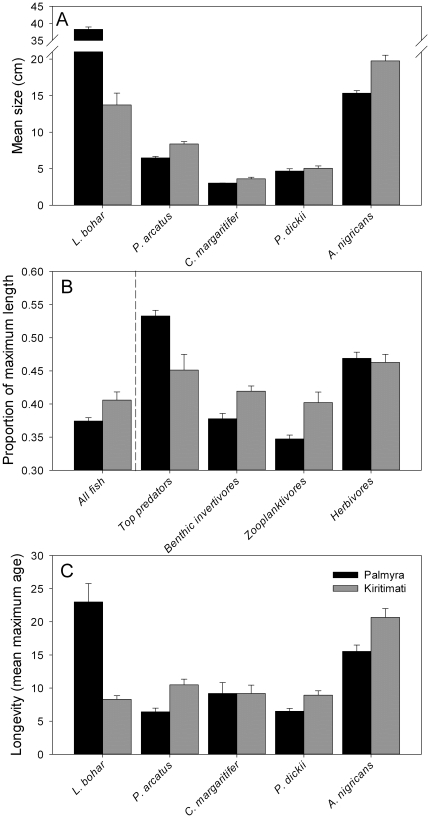
Figure 2. Size, maximum length and longevity between islands.
A) Sizes of the five study species at each island from survey data (mean length ±1 SE). B) Proportion of maximum sizes for each trophic group and all fish combined from the full species assemblage for each island, based on maximum sizes for each species from survey data (mean proportion of maximum length ±1 SE). C) Longevity for the 5 study species (Tmax, mean of top quartile, ±95% CI). Data for Palmyra are in black, data for Kiritimati are in gray.

