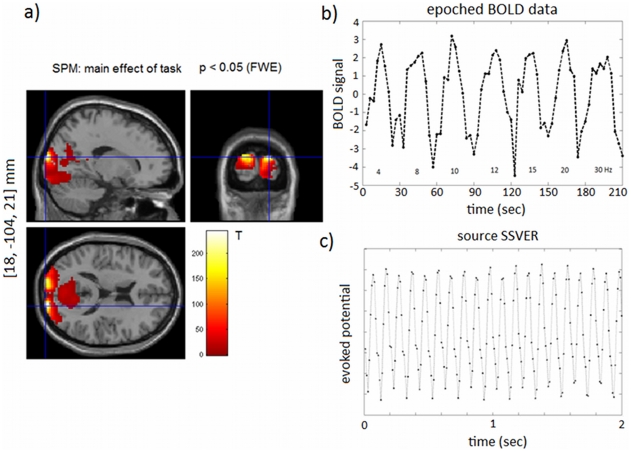
Figure 3. EEG-fMRI data.
a) SPM results (3 sessions, example subject): effect of visual flicker stimulation on fMRI data. The voxel location corresponds to the most significant cluster maximum (Talairach space),  (FWE). b) Epoched BOLD signal (eigenvariate) from the most significant cluster maximum - one example session. c) 2 second source SSVER,
  , from the same cluster peak from 1 example session and frequency (10 Hz). Both signals have been standardised (mean corrected and divided by the standard deviation of the signal) as used in the optimisation scheme.

