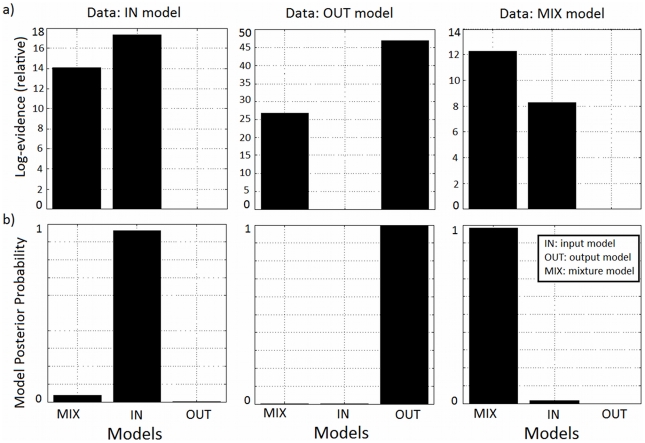
Figure 8. Model comparison with synthetic data.
We generated data with the different coupling models (IN: synaptic input model; OUT: spiking output model; MIX: mixture model). We then fitted these datasets with the same three coupling models and obtained the results plotted in the figure. a) Difference in log-evidences relative to worst model. b) Corresponding model posterior probabilities.

