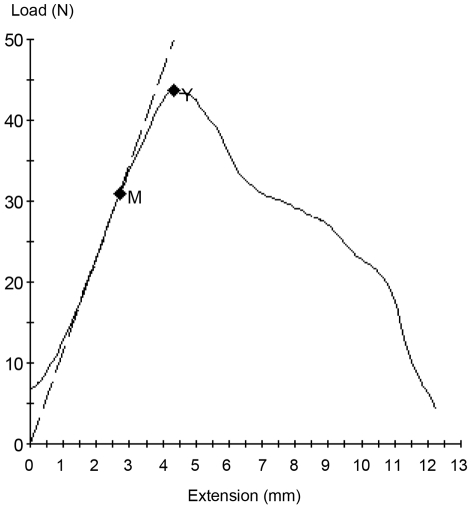
Figure 2. A representative stress-strain curve obtained from material testing.
The dashed line indicates the linear region of the curve, the slope of which is the modulus of elasticity. The point labeled M is the proportional limit that corresponds to the end of the linear region of the curve and correlates with the transition from elastic deformation to plastic deformation. During elastic deformation, if the load were removed the material would return to its original size and with no permanent deformation. Once the material progresses to plastic deformation it has undergone permanent deformation and removing the load will no longer return the material to its original size. The point labeled Y is the ultimate tensile strength, which indicates the maximum load applied to the material.

