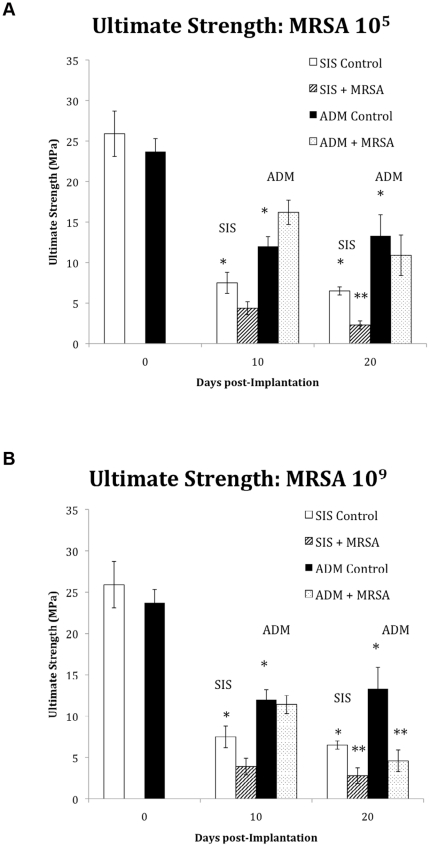
Figure 3. Ultimate strength (MPa) of SIS and ADM at 0, 10, and 20 days in response to an inoculation with 105 (A) and 109 (B) cfu MRSA.
White bars (SIS) and Black bars (ADM) represent the control (non-inoculated) values for the 2 biologic meshes at the different time points. Both materials exhibited the greatest reduction in ultimate strength at 20 days post inoculation with 109 MRSA. * Indicates a statistically significant difference between the control groups. ** Indicates a statistically significant difference between inoculated and control groups. ANOVA

