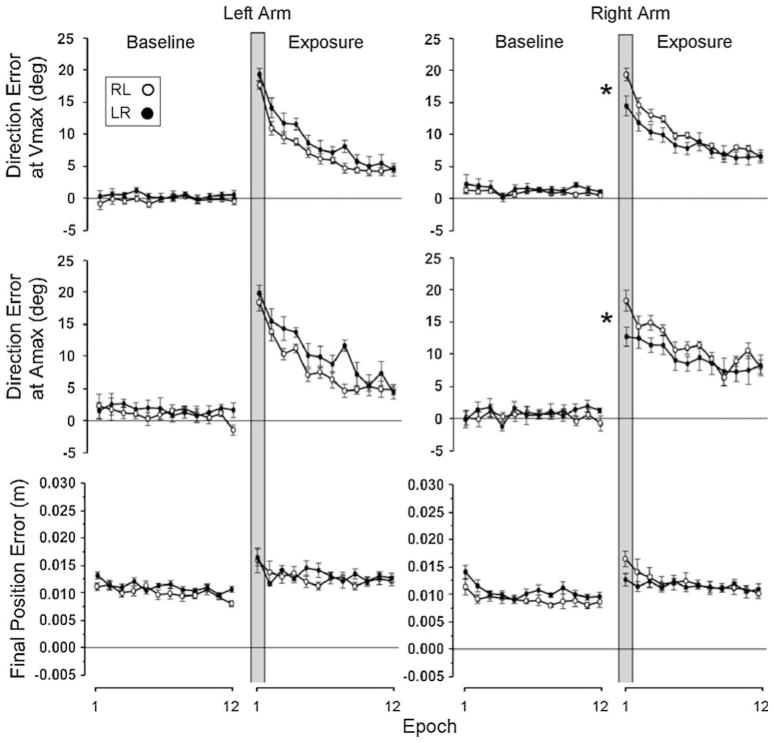
Fig. 2.
Mean performance measures of direction errors and final position error obtained from young adult subjects. Every data point shown on X axis represents the average of 16 consecutive trials (epoch) across all subjects (mean ± SE). Performance measures for the subjects who performed with the right arm first (open circles) and for those who performed with the left arm first (filled circles) are shown separately. Asterisks indicates that the two values were statistically different at P < .05

