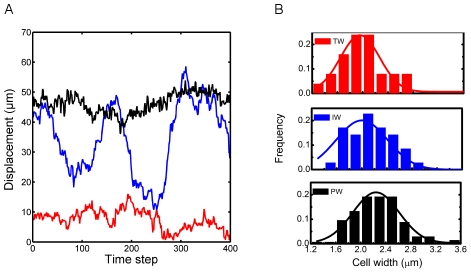
Figure 3. Distinguishing features of the motility modes.
(a) Typical displacement calculated between every 100 frames of recordings for each motility mode. While TWs and PWs maintain low and high displacement values respectively, IWs seem to alternate between these two modes. (b) Distribution of cell width (measured at the widest point) for cells of each motility mode.

