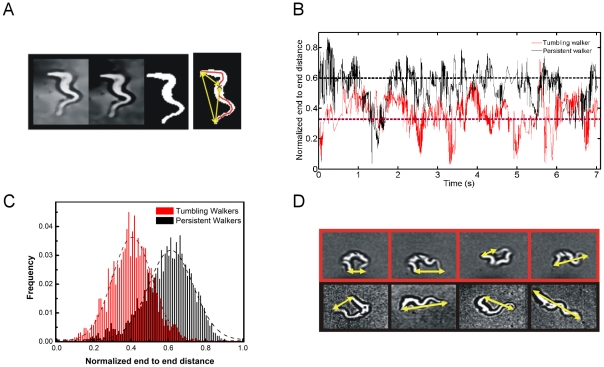
Figure 4. End-to-end distance.
(a) Image processing to obtain a skeleton line, and thereby extract the end-to-end distance. (b) Typical time series of end-to-end distance (normalized to cell length) (c) Population distributions of end-to-end distance in persistent and tumbling walkers (d) Snapshots from movies showing that persistent cells are indeed more stretched (black boxes) than tumbling walkers (red boxes).

