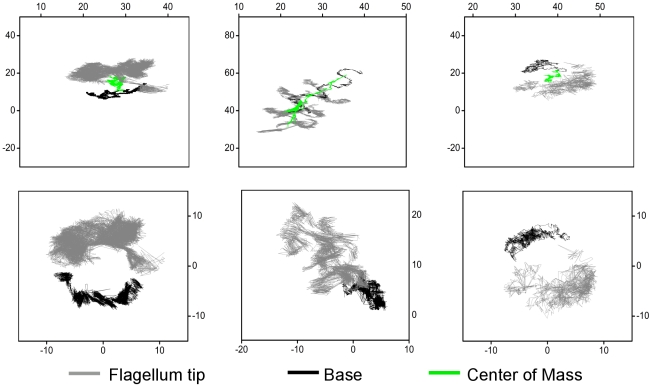
Figure 5. Cell-end trajectories.
Trajectories of tip (grey) and base (black) as well as center of mass (green) shown for 9 s (units are  ). Top three panels show the movement of the flagellum tip and base as well as the center of mass. Lower panels show the corresponding cell-end trajectories with a center of mass correction allowing us to isolate center of mass movements from cell-end movements. Left and right panels: persistent walkers, middle panel: tumbling walker - persistence is not apparent at this time scale.

