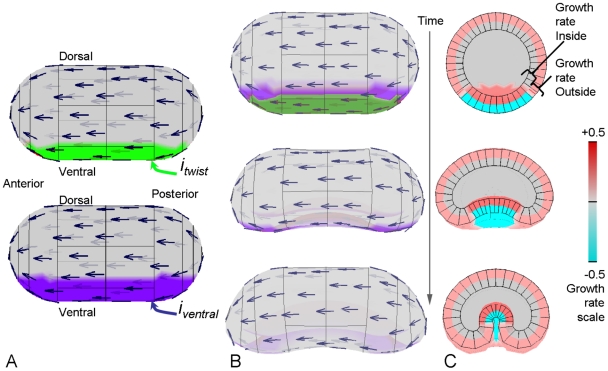
Figure 8. Invagination in the developing Drosophila embryo.
(A) Initial pattern of  and
and  on a shape that is polarised from posterior to anterior (arrows). (B) Side view of the developing embryo. The patterns become occluded as the furrow develops. (C) Transverse section of embryo showing colours representing relative specified growth rates perpendicular to the polariser gradient on the internal and external faces. The furrow is produced by a shrinkage on the outside coupled with an expansion on the inside and a net shrinkage in the ventral region (specified by
  ). Cyan shows negative specified growth on the outside and dark red shows positive growth on the inside. The images are all to the same scale.

