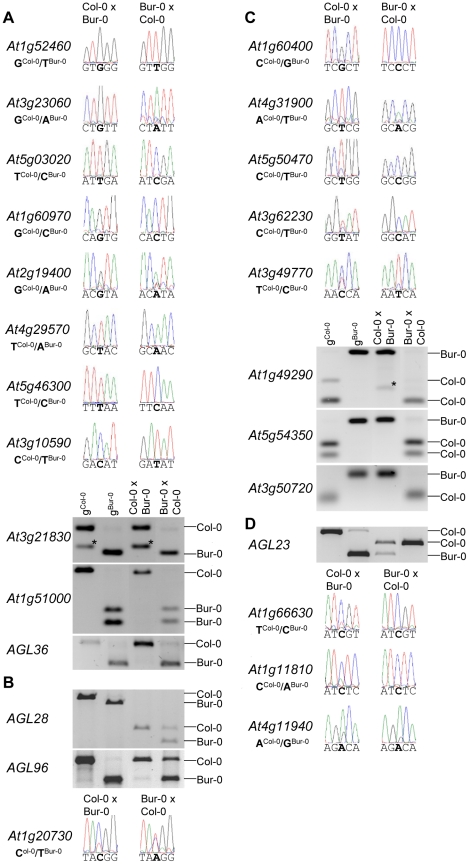
Figure 2. Allele-Specific Expression Analysis of MEGs and PEGs.
Seeds of reciprocal crosses of Col-0 and Bur-0 accessions were harvested at 4 DAP and allele-specific expression was tested by restriction-based allele-specific PCR analysis or sequencing. MEGs and PEGs that are imprinted in both directions of the cross are shown in (A) and (C), MEGs and PEGs that are accession-dependently imprinted are shown in (B) and (D). Asterisks indicate unspecific PCR bands. Size differences between controls and cDNA samples are caused by the presence of introns in amplified regions.

