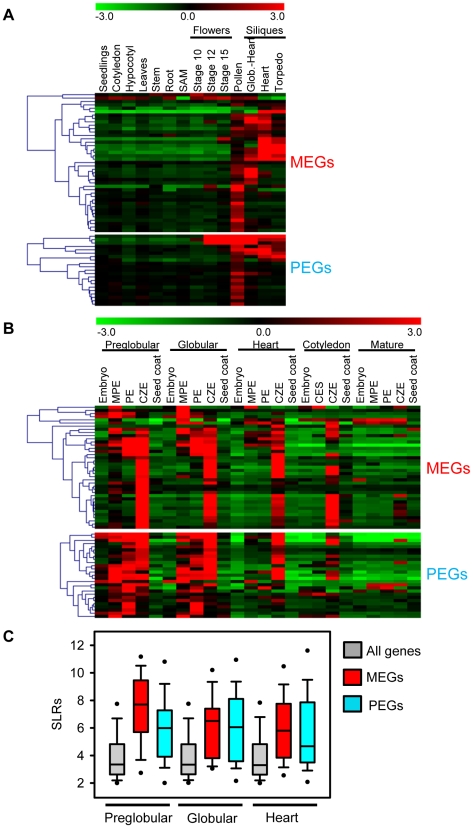
Figure 3. Expression Analysis of MEGs and PEGs in Vegetative and Seed Tissues.
(A) Cluster analysis of MEGs and PEGs (including accession-dependent MEGs and PEGs) based on their expression in vegetative tissues and seeds. Each row represents a gene, and each column represents a tissue type. Tissue types are: seedlings, cotyledons, hypocotyl, leaves, stems, roots, shoot apical meristem (SAM), flowers at stages 10, 12, 15, siliques containing seeds with embryos in the globular to heart stage, heart stage and torpedo stage. Red or green indicate tissues in which a particular gene is highly expressed or repressed, respectively. (B) Cluster analysis of MEGs and PEGs (including accession-dependent MEGs and PEGs) based on their expression in embryo, endosperm and seed coat during different stages of seed development. Each row represents a gene, and each column represents a tissue type. Tissue types are: embryos from the preglobular stage to the mature stage, micropylar (MPE), peripheral (PE) and chalazal (CZE) endosperm derived from seeds containing embryos of the preglobular stage to the mature stage, and seed coat derived from seeds containing embryos of the preglobular stage to the mature stage. Red or green indicate tissues in which a particular gene is highly expressed or repressed, respectively. (C) Box plots of expression levels of MEGs (including accession-dependent MEGs; red) and PEGs (including accession-dependent PEGs; blue) compared to all genes (gray) in the chalazal endosperm region of seeds containing preglobular, globular and heart stage embryos. SLRs, Signal Log Ratios based on ATH1 microarray signals after RMA normalization.

