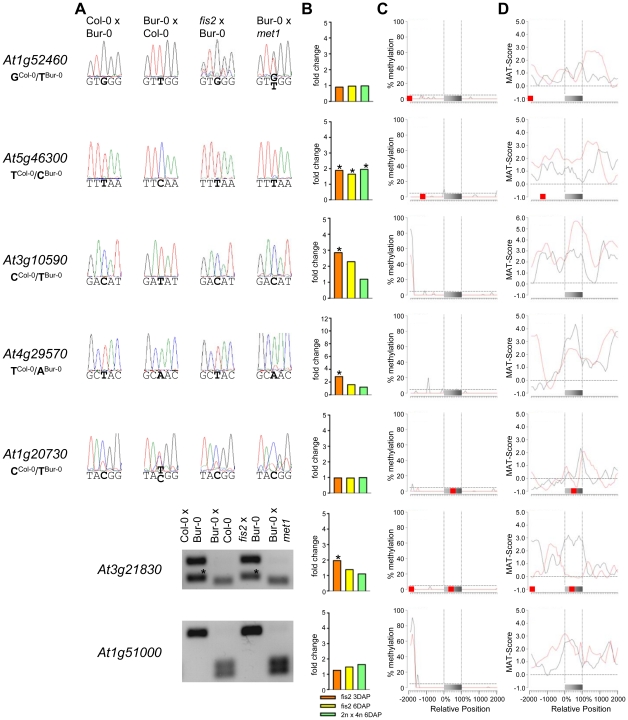
Figure 4. Impact of DNA Methylation and FIS PcG Function on the Regulation of Confirmed MEGs without Prominent Genic CG DNA Methylation.
(A) Allele-specific expression analysis of indicated MEGs in seeds derived from crosses of Col-0×Bur-0, Bur-0×Col-0, fis2×Bur-0 and Col-0×met1. Seeds were harvested at 4 DAP and allele-specific expression was tested by restriction-based allele-specific PCR analysis or sequencing. Asterisks indicate unspecific PCR bands. (B) Fold-changes of MEG expression in fis2 mutant seeds at 3 and 6 days after pollination (DAP) and from seeds derived from pollination with tetraploid pollen donors at 6 DAP compared to wild-type seeds at the corresponding time points. Data are based on ATH1 microarray signals after RMA normalization. Significantly deregulated genes are marked by an asterisk. (C) CG DNA methylation profiles of indicated MEGs in vegetative tissues (black line) or endosperm (red line) based on data published by [7], [41]. The gray bar represents the annotated gene body from transcription start (left) to transcription end (right). Red boxes represent transposable elements. Profiles are shown for 5% length intervals along the gene body and for 100 bp sequence intervals for the 2-kb regions upstream and downstream of each gene. The vertical dotted lines mark the gene body. The horizontal dashed line marks the DNA methylation level in vegetative tissues of TAIR8-annotated genes at the transcriptional start site. (D) H3K27me3 profiles of indicated MEGs in vegetative tissues (black line) or endosperm (red line) based on data published by [52], [64]. The gray bar represents the annotated gene body from transcription start (left) to transcription end (right). Red boxes represent transposable elements. Profiles are shown for 5% length intervals along the gene body and for 100 bp sequence intervals for the 2-kb regions upstream and downstream of each gene. The vertical dotted lines mark the gene body. The horizontal dashed line marks the H3K27me3 level of TAIR8-annotated genes at the transcriptional start site.

